This just in from Mrs. Baldwin!
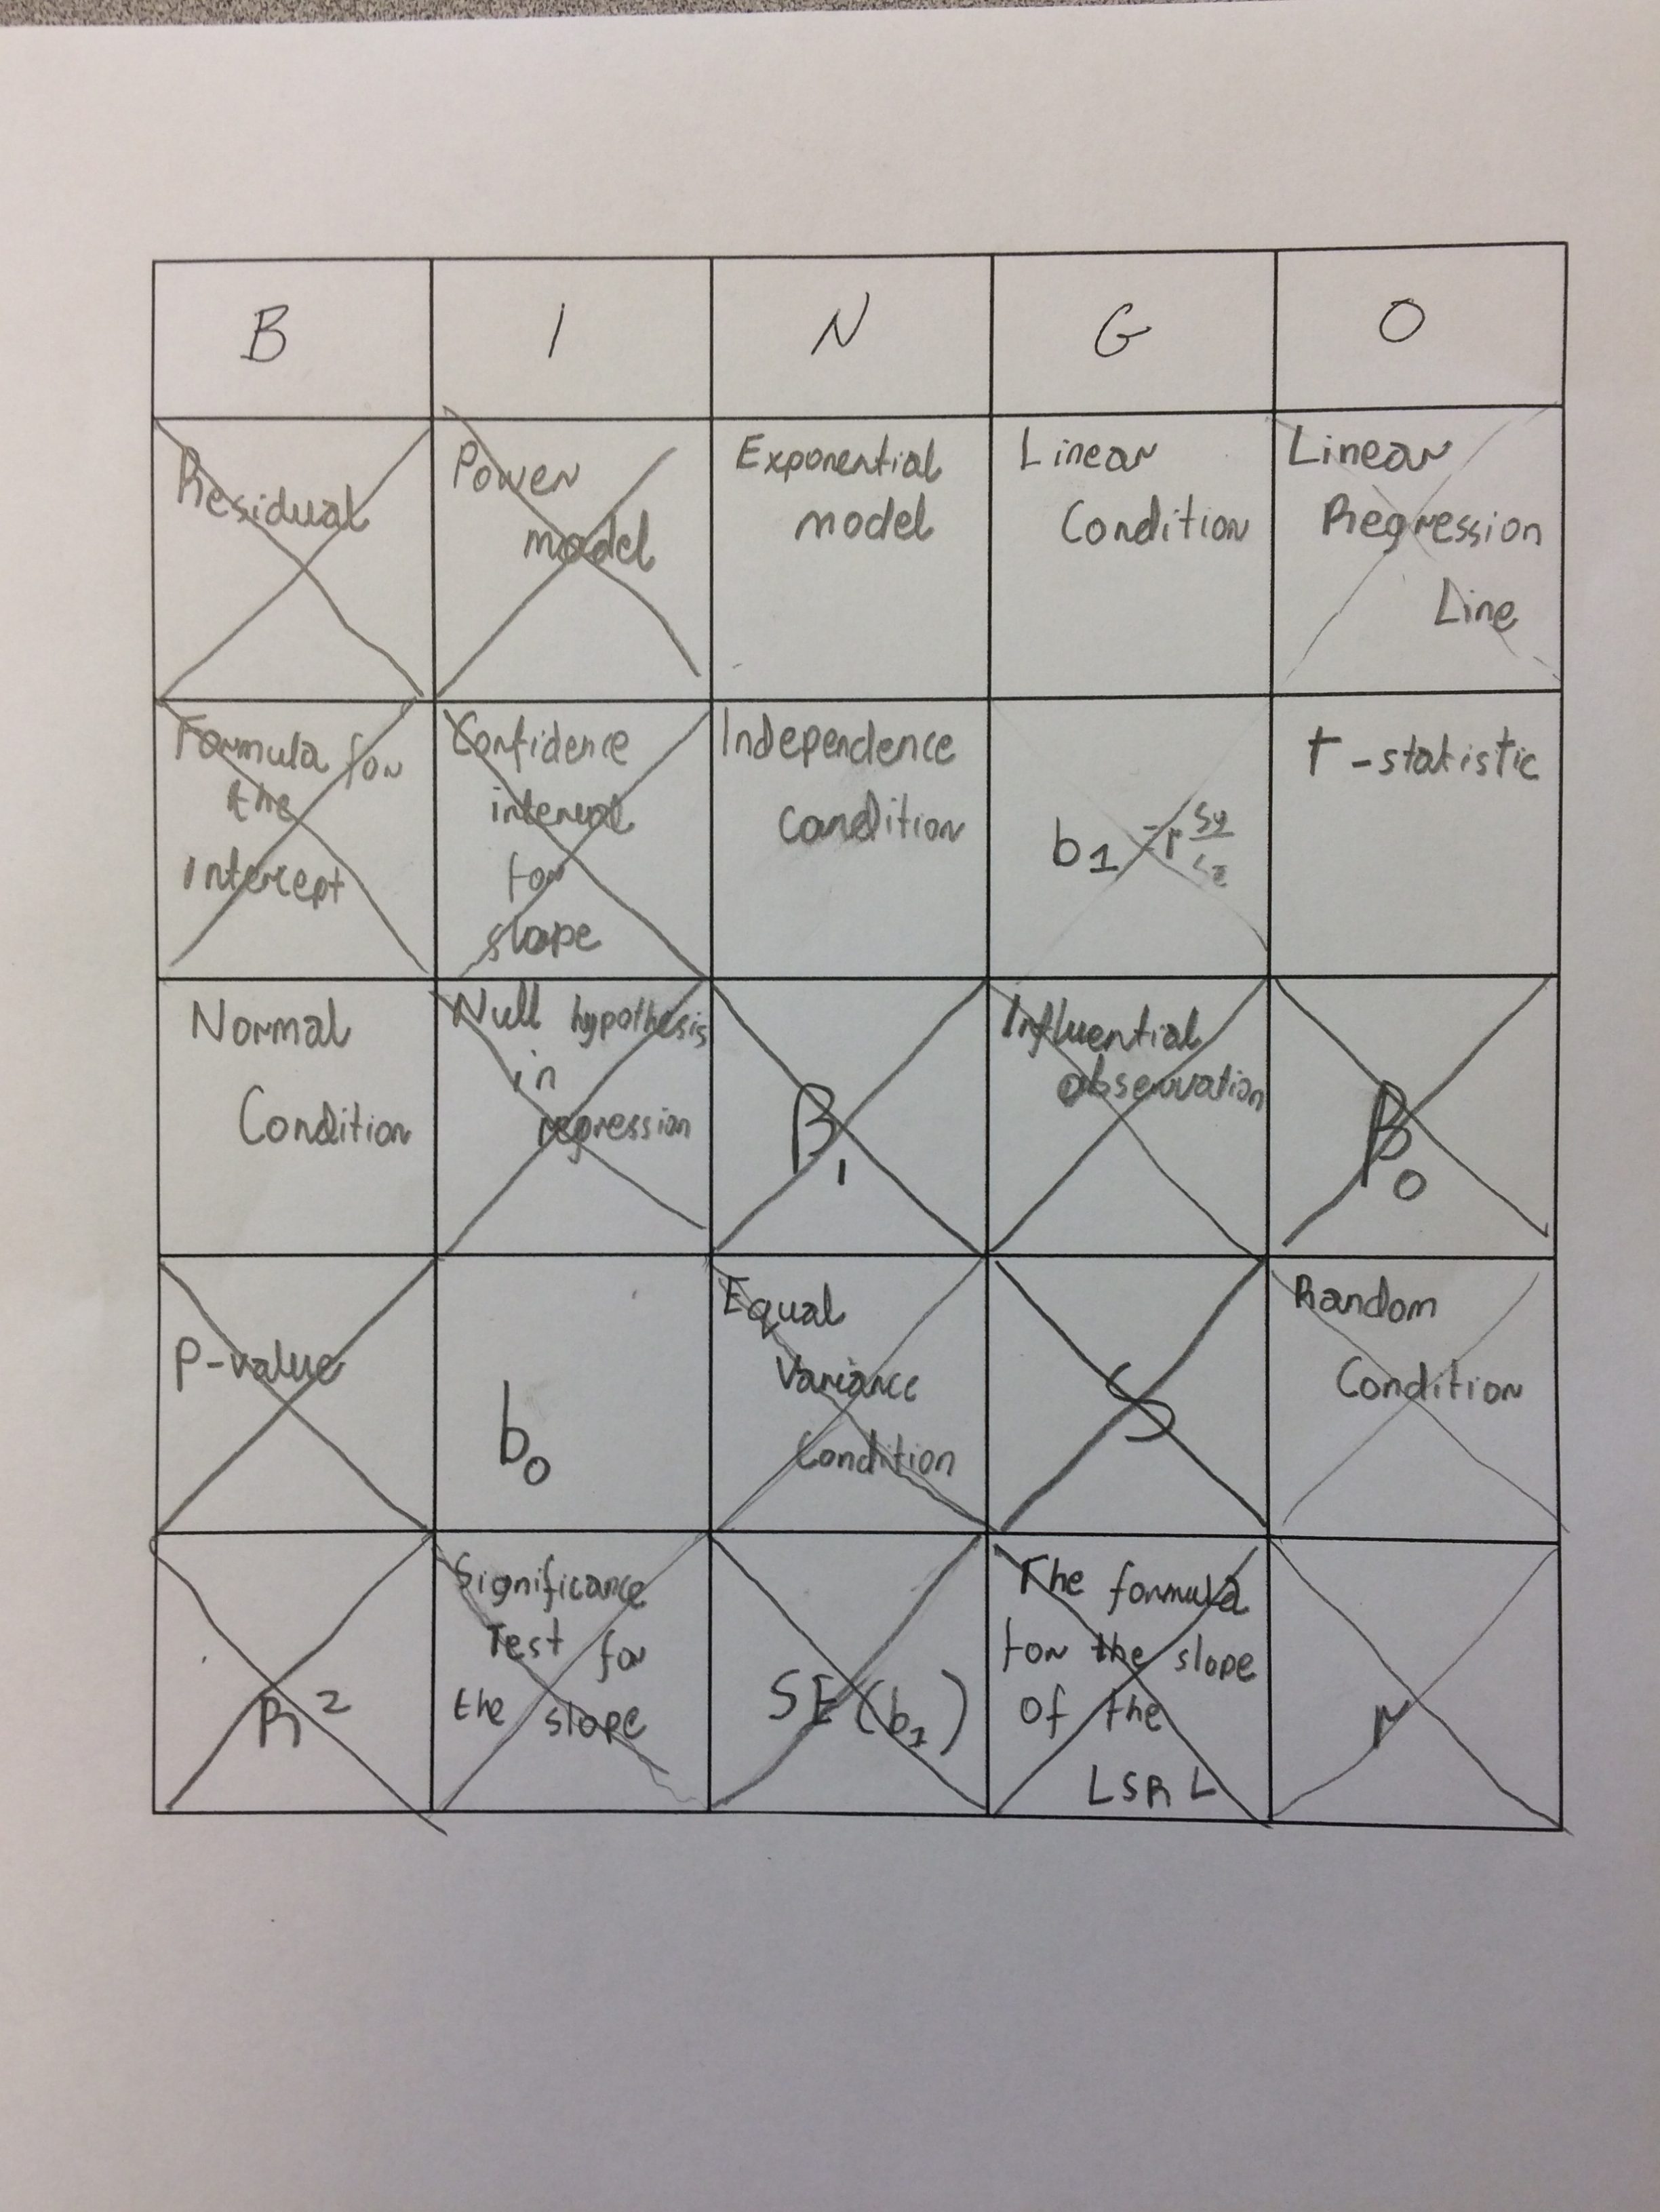
As we prepare for the AP statistics exam, we need to review several terms and concepts. One way we can do this is with BINGO. Students complete their grids with a list of terms, in an arbitrary (not random) order. Then they are given definitions and examples. They must match the definitions and examples with the core correct terms in order to win. It is very exciting!
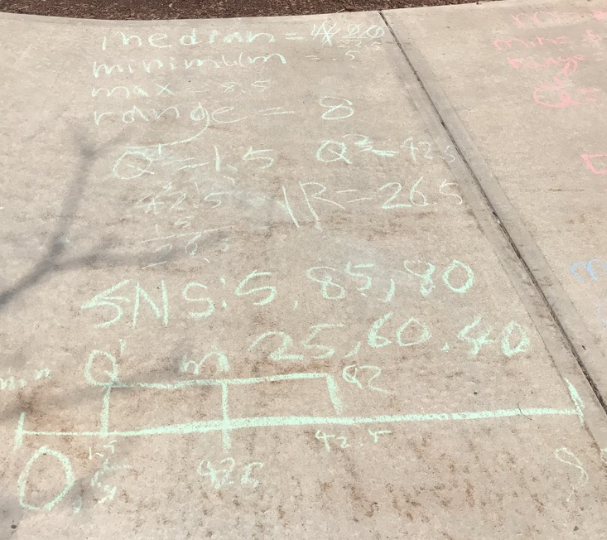
With awesome weather all around, we just had to work on math outside, in chalk, on sidewalks around campus!
From Mrs. Baldwin:
 The Trig/Prob/Stats class learned about describing data with numerical summaries and graphical displays. We took our work outside to practice these skills. We studied a data set of travel times to work for 20 NYC residents. We found that the median travel time was 22.5 minutes, the minimum was 5 minutes and the maximum was 85 minutes. Students also learned to use a new measure of spread called the interquartile range. This measures the range of the middle half of observations. We found that the middle half of travel times for these New Yorkers vary from 15 minutes to 42.5 minutes. Working outside in the chalk brought a kinesthetic element to our learning that was fun and engaging.
From Mr. Seamon:
All about math department projects and events.