 This just in from Ms. Baldwin:
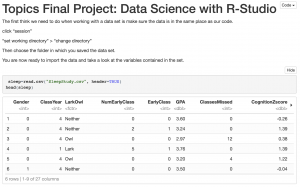
We are working on a project using R-studio that employs some of the latest tools for Data Science. #ggplot2 and #dplyr. I picked up some new tricks at the conference #ODSCwest2017.
You can check out the project right here.
With awesome weather all around, we just had to work on math outside, in chalk, on sidewalks around campus!
From Mrs. Baldwin:
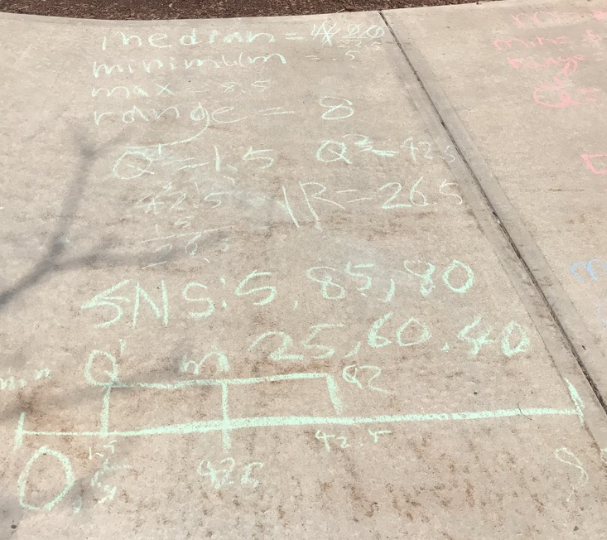
 The Trig/Prob/Stats class learned about describing data with numerical summaries and graphical displays. We took our work outside to practice these skills. We studied a data set of travel times to work for 20 NYC residents. We found that the median travel time was 22.5 minutes, the minimum was 5 minutes and the maximum was 85 minutes. Students also learned to use a new measure of spread called the interquartile range. This measures the range of the middle half of observations. We found that the middle half of travel times for these New Yorkers vary from 15 minutes to 42.5 minutes. Working outside in the chalk brought a kinesthetic element to our learning that was fun and engaging.
From Mr. Seamon:
Check out this awesome message and visualization created by Mrs. Baldwin!
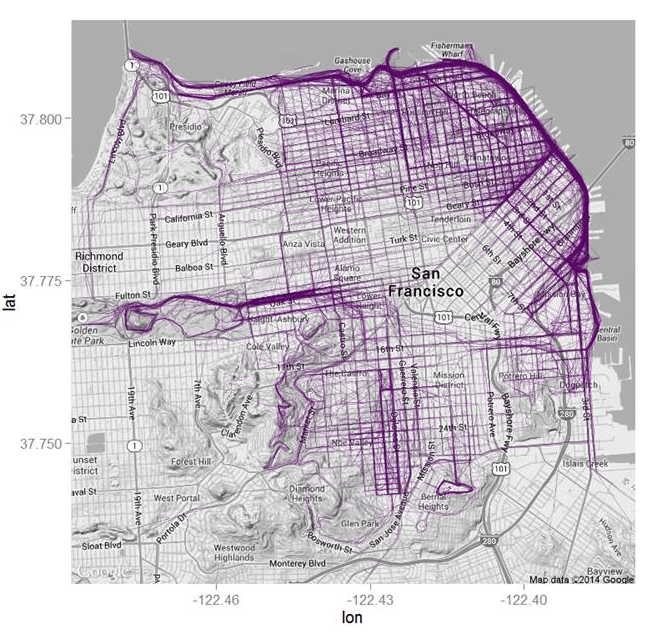
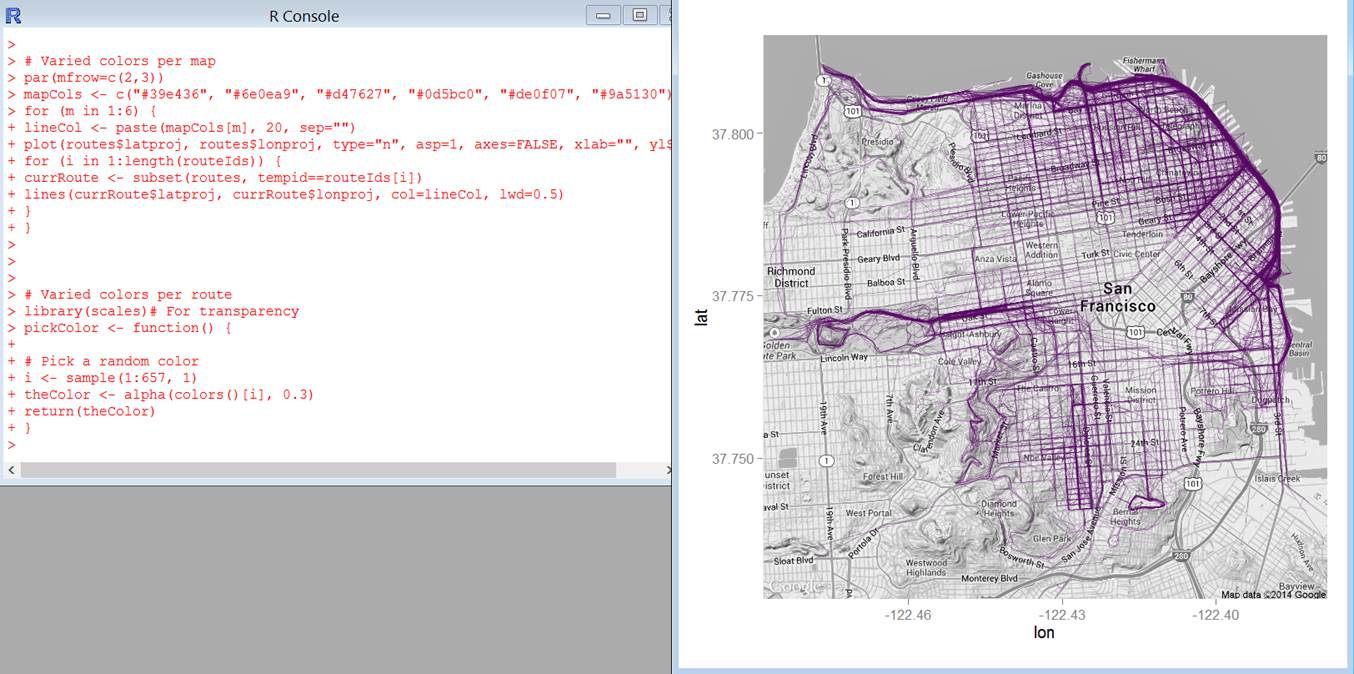
“R is arguably the most powerful statistical analysis tool out there. Its features extend far into the world of data visualization. After the AP Statistics exam, students will have the opportunity to learn and develop their skills in the R environment creating graphics such as this. The graphic overlays data from RunKeeper onto a map of San Francisco. This visualization shows the most frequently travelled routes for runners in the city!
Inspiration and script from flowingdata.com.”
All about math department projects and events.

 This just in from Ms. Baldwin: