

Here’s what Mrs. Baldwin has to say about the sleep data she collected over the last 6 weeks:
“As good statisticians, we of course recognize that our data are being collected through voluntary sampling. This is less of a problems when the data are easy to gather and we give several opportunities for people to participate. The data should represent the Williston community fairly well, but likely underrepresent faculty and students who don’t find themselves on the Math floor of the Schoolhouse.
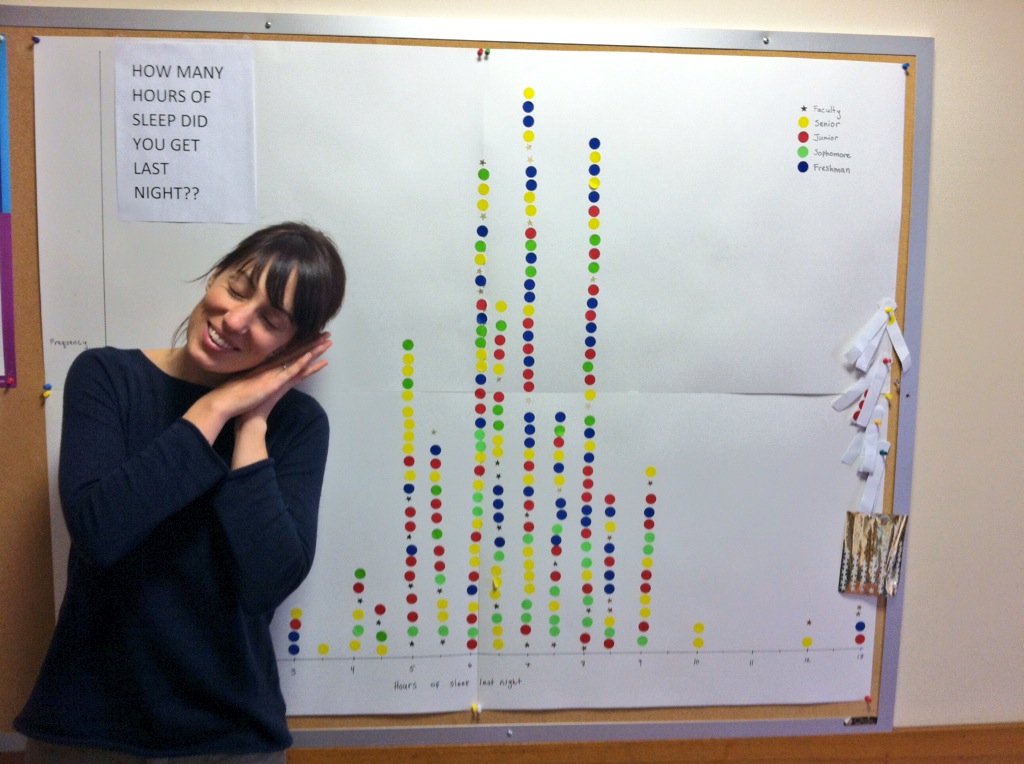
We can see that our community of Williston students and faculty shows a lot of variation. We have a low of one hour of sleep and a high of 13 hours. A typical member of the community gets about 7 hours with the observations becoming less and less common as they extend above or below that. Since there are about as many high extremes as there are low extremes and there is a single peak, we call the shape of the picture “unimodal” and “symmetric” (we could fold the graph in half and get about the same picture on either side). Our observations about the shape suggest that the underlying distribution could very well be our good friend The Normal Distribution. We’ll see you again soon, Normal Distribution, bye for now…”
How many hours of sleep did you get last night?
